
Several years back I wrote a two part blog series in response to seeing questions about plotting and reordering on list serves, talkstats.com, and stackoverflow. Part I discussed the basics of reordering plots by reordering factor levels. The essential gist was:
So if you catch yourself using “re-arrange”/”re-order” and “plot” in a question think…factor & levels
Part II undertook re-ordering as a means of more easily seeing patterns in layouts such as bar plots & dot plots.
Well there is at least one time in which reordering factor levels doesn’t help to reorder a plot. This post will describe this ggplot2 based problem and outline the way to overcome the problem. You can get just the code here.
The Problem
In a stacked ggplot2 plot the fill ordering is not controlled by factor levels. Such plots include a stacked bar and area plot. Here is a demonstration of the problem.
Load Packages
if (!require("pacman")) install.packages("pacman")
pacman::p_load(dplyr, ggplot2)
Generate Data
Here I generate a data set containing a time series element (Month), counts (Count), and a leveling variable (Level). The counts are transformed to proportions and the Level variable is converted to a leveled factor with the order “High”, “Medium”, “Low”. This leveling is key to the problem as it will be used as the fill variable. It is here that reordering the factor levels will not work to reorder the plot.
dat <- data_frame(
    Month = rep(sort(month.abb), each = 3),
    Count  = sample(10000:60000, 36),
    Level = rep(c("High", "Low", "Medium"), 12)
) %>%
    mutate(
        Level = factor(Level, levels = c("High", "Medium", "Low")),
        Month = factor(Month, levels = month.abb)
    ) %>%
    group_by(Month) %>%
    mutate(Prop = Count/sum(Count))
Plot a Stacked Area Plot
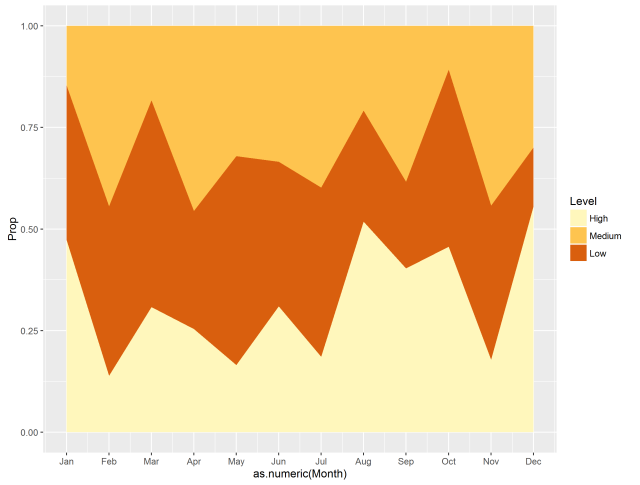
Next we generate the area plot. The accompanying plot demonstrates the problem. Notice that the legend is ordered according to the factor levels in the Level variable (“High”, “Medium”, “Low”) yet the plot fill ordering is not in the expected order (it is “Medium”, “Low”, “High”). I arranged the factor levels correctly but the plot fill ordering is not correct. How then can I correctly order a stacked ggplot2 plot?
dat %>%
    ggplot(aes(x=as.numeric(Month), y=Prop)) +
        geom_area(aes(fill= Level), position = 'stack') +
        scale_x_continuous(breaks = 1:12, labels = month.abb) +
        scale_fill_brewer(palette = "YlOrBr")
The Solution
Reorder the Stacked Area Plot
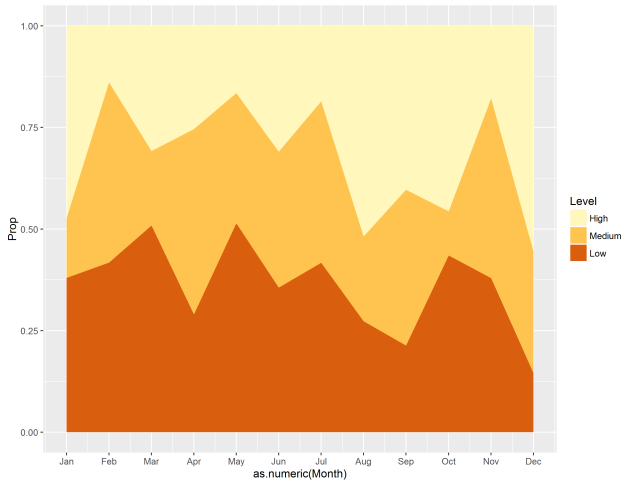
It seems ggplot2 orders the plot itself by the order in which the levels are consumed. That means we need to reorder the data itself (the rows), not the factor levels, in order to reorder the plot. I use the arrange function from the dplyr package to reorder the data so that ggplot2 will encounter the data levels in the correct order and thus plot as expected. Note that base R‘s order can be used to reorder the data rows as well.
In the plot we can see that the plot fill ordering now matches the legend and factor level ordering as expected.
dat %>%
    arrange(desc(Level)) %>%
    ggplot(aes(x=as.numeric(Month), y=Prop)) +
        geom_area(aes(fill= Level), position = 'stack') +
        scale_x_continuous(breaks = 1:12, labels = month.abb) +
        scale_fill_brewer(palette = "YlOrBr")
This blog post has outlined a case where reordering the factor levels does not reorder the plot and how to address the issue.

Pingback: How do I re-arrange??: Ordering a plot re-revisited – Mubashir Qasim
Wow, how serendipitous; I was literally struggling to solve this problem today and I remembered your old blog post on it and was annoyed that it wasn’t fixing my issue.
Checked the latest posts just for interests sake and BAM, problem fixed.
Thanks a lot! Great post
Pingback: How do I re-arrange??: Ordering a plot re-revisited | r software hub
This is a fantastically useful post. Thank you. After hours reading through others’ questions and the answers left, this was the only one that explained to me what was going on and why my attempts to reorder the factor levels were not having the desired effect. And all done very succinctly too, which is important when you’ve trawled though lots of potential solutions. Very much appreciated!